SIXTH GRADE CREEK STUDIES
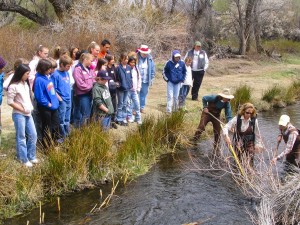
Sixth-grade students are introduced to the Watershed Project by investigating a tributary to the Owens River. Each school works on a creek located near their school. The students are introduced to field sampling techniques used to evaluate the health of a watershed.
- Water Quality Water quality is key in the health of a watershed. All forms of life depend on the water and its quality will determine what can live within the watershed. Students run the following tests: temperature, pH, dissolved oxygen, nitrates, phosphates, total dissolved solids, hardness, and turbidity.
 Electrofishing Study
A fishery biologist shows the students how they sample fish using electrofishing. Students learn which species of fish inhabit the stream, where the fish are more often found, and how many fish are in a section of the stream. Following the demonstration, students learn to handle fish, identify fish species, weigh, measure and take scale samples from the fish. Back in the classroom, students age the fish from their scales.- Greenline Students learn one method used by botanists to quantify vegetative growth along stream banks. They learn to identify common riparian vegetation found along the creek and discuss why the quality of stream-bank vegetation is important.
- Aquatic Macroinvertebrates Aquatic macroinvertebrates are used as biological indicators of water quality and stream health. Students sample the population of macroinvertebrates in the creek and identify them using a simplified key.
- Stream Flow The amount of water flowing in a stream can change dramatically from season to season. These changes shape the channel, create habitat for living creatures and influence the streamside vegetation. Using a flow meter the students learn how to measure the amount of water in the channel can be measured.

Prior to coming into the field, the students are introduced to watershed studies through the use of two GEMS (Great Explorations in Math and Science, Lawrence Hall of Science, Berkeley) guides. They explore the interaction in an aquatic ecosystem with the Aquatic Habitats guide and experiment with stream channel development using the River Cutters guide. Following the field program, student understanding is evaluated through the Sage Grouse Creek simulation activity.
LOWER OWENS RIVER STUDIES
One of the largest river restoration projects in history is happening in the Owens Valley. In the winter of 2006, the Los Angeles Department of Water and Power reintroduced water into 63 miles of the Lower Owens River that had essentially been dry since it was diverted to Los Angeles in 1913. The Eastern Sierra Watershed Project (ESWP) gives local students the opportunity to participate in the monitoring of the restoration of this river. The on-going project has given new meaning to hands-on science education, as local students experience their natural environment as a living laboratory through real-world scientific activities. Students began collecting “before” data from four study sites along the dry channel in 2002. Since 2006, 7th and 8th-grade students from up and down Inyo County have traveled to the Lower Owens River to document the changes taking place.
SEVENTH GRADE INVASIVE SPECIES
The 7th-grade students are looking at how the re-watering affects life along the river. They are focusing on invasive species. The classroom unit Introduced Species, from the Global Environmental Change series, written by the National Science Teachers Association, is recommended to accompany the field program. There is also a plant identification activity to be completed prior to the field studies. After the field studies, students take the data collected in the field, and using the database, calculate a water quality index from the invertebrate data, summarize and compare the plant and wildlife data to past years.
- Wildlife Signs can include scat, pellets, feathers, bones, burrows, wildlife trails, sounds/calls, and tracks. Students walk through the area looking for signs of wildlife. Baited scent stations are set up the night before to attract nocturnal animals. Students learn to identify animal tracks and scat. Students also learn to identify carnivores, herbivores, and omnivores by their dentition (teeth).
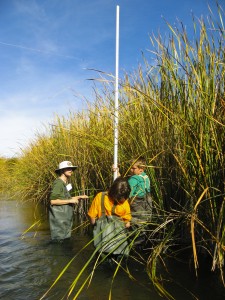
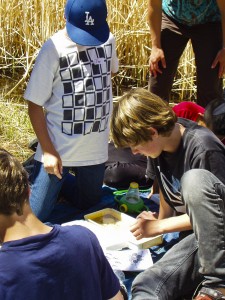 Aquatic Macroinvertebrates Survey – Watching for the Invasive New Zealand Mud Snail Students are surveying for the New Zealand Mud Snail in the Lower Owens River while collecting data on the macroinvertebrate population of the river. Students use Hester-Dendy samplers and leaf pack nets, which are put out 2 months prior to the field trips, to collect aquatic macroinvertebrates. They identify and quantify the macroinvertebrates living in the Lower Owens River and then compared their data to past years. Back in the classroom, the students learn to calculate the water quality index using the data they collected in the field.
- Invasive Plant Survey Students learn to identify the plants that occur commonly along the Lower Owens River. Native uses and interesting facts about the plants are part of a plant walk. Permanent transects for point line intercept vegetation monitoring have been established. Students are observing the trends of any introduced species that are present and if the native vegetation can out-compete introduced vegetation.

EIGHTH GRADE PHYSICAL SCIENCE
Inyo County 8th graders further their understanding of the Owens River Watershed, by monitoring the soils and vegetation, stream channel morphology, and water quality changes occurring on the Lower Owens River. Prior to coming into the field, the students participate in a simulated watershed investigation, Environmental Detectives, a GEMS guide (Great Explorations in Math and Science, Lawrence Hall of Science, Berkeley). After returning to class, the students complete a soil textural analysis lab and use the ESWP database to compare the data they collected to that of past years.
- Soil and Vegetation Investigation Students are introduced to basic soil properties and then describe the following soil characteristics as found in one horizon or layer of soil: depth, moisture, consistency, structure, color, texture, rocks, roots, carbonates, ph, salinity, temperature. Comparisons are made of river channel soils and upland soils. Vegetation data is collected for both soil types. As part of the follow-up, students complete a lab to determine the particle size composition of the soils sampled in the field. Then the students learn how soil and vegetation information collected in the field is used to make land management decisions.
 Stream Morphology At the Black Rock Study site, the channel of the Lower Owens River was totally dry. In the fall of 2002, the students mapped 26 cross-sectional transects of the dry stream channel. Since then students have continued to map these permanent cross-sectional transects. The data is recorded on palm pilots and in their field journals. Using photographs and channel graphs from each year they are able to compare them to past years.
- Water Quality What changes occur in the following water quality parameters: temperature, pH, dissolved oxygen, total dissolved solids, and turbidity during the re-watering project? Using water quality probes and chemical tests, water quality data is collected.

For more information on the Eastern Sierra Watershed Project or to volunteer, please contact project coordinator, Nicole Elgersma, at nelgersma@inyocoe.org, or 760-873-3262, ext. 2131
More details about current programs on Inyo County Office of Education’s ESWP Google Site here.